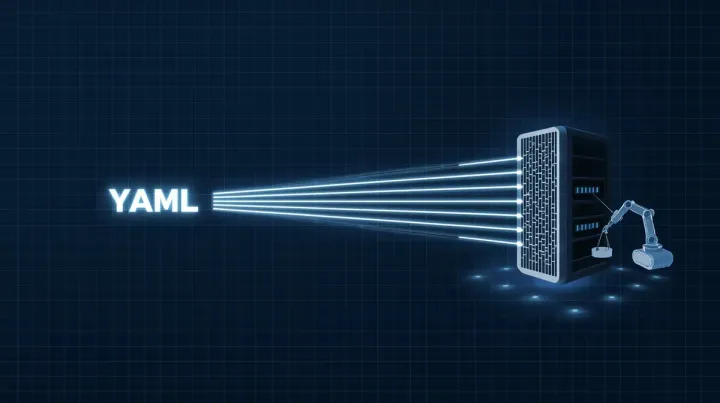
Unlocking Linux Superpowers with eBPF and xstack
If you’ve ever worked on a complex system, you know the pain of the “heisenbug”-a problem that changes or disappears the moment you try to observe it. This is especially true in performance tuning. The very tools we use to measure overhead can, ironically, add enough overhead to change the system’s behavior, sending us on a wild goose chase.
For years, this was just a cost of doing business. But a revolutionary technology inside the Linux kernel has been changing the game completely. It’s called eBPF, and it’s the closest thing we have to superpowers for our systems.
So, What on Earth is eBPF?
Think of the Linux kernel as a heavily fortified, protected space. You can’t just run any code you want in there-and for good reason. A single bad line of code could bring down the entire system.
eBPF (extended Berkeley Packet Filter) is a clever way around this. It allows you to write small, safe, sandboxed programs that can be attached to almost anywhere in the kernel. Imagine it as a tiny, secure virtual machine inside the kernel itself. You can write code to observe network packets, system calls, function entries, and more, without having to recompile the kernel or load risky modules. It’s like having safe, programmable hooks into the deepest parts of the operating system.
The Problem with Looking: When Profiling Affects Performance
Traditional profiling tools, even powerful ones, often rely on instrumentation. They inject little bits of code (tracepoints, kprobes) that say, “Hey, let me know when this function is called.” While incredibly useful, this isn’t free. Each trigger adds a tiny bit of latency and overhead. In a high-frequency, performance-sensitive production environment, millions of these tiny overheads can add up, altering the very performance you’re trying to measure.
This is the observer effect in action. You can’t be sure if the bottleneck you’re seeing is a real issue or an artifact of your own measurement.
Enter xstack: The Power of Passive Observation
This is where a new generation of tools, like Tanel Poder’s xstack, comes in. It leverages modern eBPF features to do something brilliant: it profiles the system passively.
Instead of injecting tracepoints, xstack uses an eBPF task iterator to periodically and safely take a snapshot of what every thread in the system is doing at that moment-both in user-space and kernel-space. It’s the ultimate fly on the wall. It doesn’t interrupt the running processes or inject any code. It just looks. The result is profiling with almost zero overhead, making it safe to use even on the most sensitive production systems.
Why This is a Game-Changer
Tools like xstack represent a fundamental shift in how we approach performance analysis on Linux. The ability to get a complete, system-wide picture of what’s happening, without fear of contaminating the results, is a massive leap forward.
This isn’t just an academic exercise. It means faster debugging, more reliable applications, and a deeper, truer understanding of how our code behaves in the real world. It’s a powerful example of the constant innovation happening in the open-source community, turning the complex, powerful capabilities of the Linux kernel into accessible tools that can solve real-world problems. The superpowers were always there; now we have a safer way to use them.
You can find the xstack tool discussed in this post on GitHub.